
Mean, Median, Mode Formula and its Definition & Examples
- Home
- Mean, Median, Mode Formula
Mean, Median, Mode Formula: Today’s world is surrounded by big data usage as we find it in every sphere of life from newspapers to mobile phones. The data are present all around us. If we want to figure out some key data out of the big data set then we need to consider only certain representatives of that data. It can be possible with the help of finding a central tendency or average, namely mean, median, and mode. While explaining a set of data, the central position of the data set is identified which is called the measure of central tendency. In the study of statistics, mainly 3 measures of central tendency are available Mean, Median, and Mode. In this article, we explain the meaning of Mean, Median, and Mode, the concepts of Mean, Median, and Mode with solved examples, and the Mean Median Mode formula.
Mean Median Mode Formula
The mean is considered the arithmetic mean of the given data. The Median is the middlemost observation of the given data set when the data is arranged in ascending pattern. Mode is the observation that occurs most in the given data set. Here the formula of mean, median, and mode is explained below separately.
Mean Formula
Mean is defined as the average of a particular data set arithmetically. The mean of a given data is calculated by the addition of all given observations divided by the total number of observations in the data set. Let’s consider that a batsman scores some runs in five T20 matches as follows 35, 24, 49, 57, 16. For calculating his average score in these five matches, we have to find the arithmetic mean of these runs with the help of the mean formula:
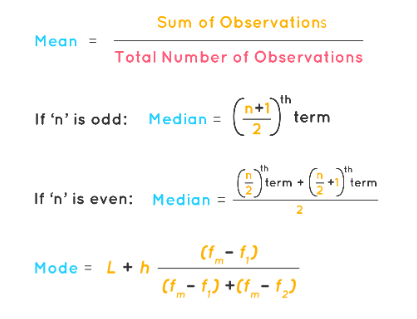
Mean = Sum of all observations / Total Number of observations
Now, Mean or Average runs scored by that batsman = (35+24+49+57+16) / 5
Mean = 181 / 5 = 36.2
In statistics, the Mean is symbolized by x̄ (pronounced as ‘x bar’).
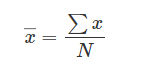
Here,
∑ denotes the summation or addition
X denotes the given observations
N denotes the total number of given observations.
In the case of the tabular data, the Mean formula to be used is given below
Mean = ∑f x / ∑f
Here ∑f = N
The value of the mean is not a number from the original given data set. It gives a common result from the arithmetic average calculations. It is to be noted here that the resulting value of the mean will not be one number described in the given data set.
Mean Formula Solved Questions
The data can be given in the form of a raw pattern or tabular pattern. Here some solved problems are given related to the Mean in both the cases of raw data and tabular data.
Raw Data Problems
Suppose x1, x2, x3, . . . , xn be n observations.
We can calculate the mean arithmetically with the help of the mean formula mentioned below.
Mean x̄ = (x1 + x2 + ... + xn) / n
Question 1: If the heights of 5 boys are 132 cm, 140 cm, 143 cm, 148 cm, and 151 cm. Calculate the mean height of these five boys.
Solution: Mean Height x̄ = (132 + 140 + 143 + 148 + 151) / 5
= 714 / 5 = 142.8
Hence Mean Height x̄ of five boys = 150 cm
Question 2: The mean of the three numbers is observed to be 12. If one number is excluded, then the mean is found to be 8. Calculate the number that is not included.
Solution: Given that, the total number of observations n = 3
The mean value x̄ = 12
By using the Mean Formula, x̄ = ∑ x / n
∑ x = x̄ * n = 12 x 3 = 36
The sum of the given 3 observations is 36
Imagine that the excluded number is z
The sum of two observations = 36 – z
Mean value of 2 observations = (36 – z) / 2
8 = (36 – z) / 2
36 – z = 16
z = 36-16 =20
Hence, the excluded number is 20.
Tabular Data (Frequency Distribution) Problems
If the data is given in the form of a table then we need to apply the following Mean formula:
Mean x̄ = (x1f1 + x2f2 + ……+ xnfn) / (f1 + f2 + ... + fn)
Question 1: Calculate the mean value of the following distribution:
| x | 2 | 4 | 7 | 11 | 17 |
| f | 4 | 12 | 11 | 5 | 3 |
Solution: Arrange the data of the table as given below for finding the mean value,
| xᵢ | fᵢ | xᵢfᵢ |
| 2 | 4 | 8 |
| 4 | 12 | 48 |
| 7 | 11 | 77 |
| 11 | 5 | 55 |
| 17 | 3 | 51 |
| ∑ fᵢ = 35 | ∑ xᵢ fᵢ = 239 |
Mean x̄ = (∑xᵢ fᵢ) / (∑fᵢ)
x̄ = 239 / 35 = 6.82 (Approx.)
Hence the Mean value of the given distribution is 6.82 (Approx.).
Question 2: A table is given that represents the data on the number of students visiting a library per month. Calculate the average number of students visiting the library per day.
| Number of Students | Number of days visiting Library |
| 0-10 | 3 |
| 10-20 | 5 |
| 20-30 | 8 |
| 30-40 | 10 |
| 40-50 | 6 |
| 50-60 | 7 |
Solution: In this question, we have to apply the classmark (mid-point of a class) concept for finding the mean. Let x1, x2, x3, . . . , xn be the class marks of the respective categories. So we get the following table:
| Classmark (xᵢ) | Frequency (fᵢ) | xᵢfᵢ |
| 5 | 3 | 15 |
| 15 | 5 | 75 |
| 25 | 8 | 200 |
| 35 | 10 | 350 |
| 45 | 6 | 270 |
| 55 | 7 | 385 |
| Total | ∑ fᵢ = 39 | ∑ fᵢxᵢ = 1295 |
Mean x̄ = (∑ xᵢfᵢ) / (∑ fᵢ)
x̄ = 1295 / 39 = 33.2 = 33 (Approx.)
Hence the average number of students visiting the library per day is 33.
Median Formula
Median is defined as the middle number in a given data set if the given numbers or observations are arranged in either ascending or descending patterns. Hence Median refers to the value of the middlemost observation present in the given data set after organizing the data in ascending or descending order. For example, imagine the data: 3, 7, 15, 2, 6, 6. Now arrange this data set in ascending pattern: 2, 3, 6, 6, 7, 15. A total of 6 observations are given. Hence the value of the Median of this data is the middle value i.e. 6.
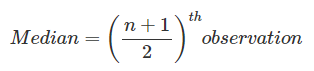
When the total number of observations (n) is odd in number then the Median formula to be used is mentioned below:
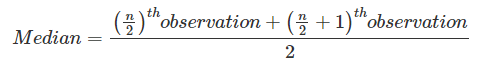
When the total number of the observations (n) is even in number then the Median formula to be used is mentioned below:
Median Formula Solved Questions
The data can be given in the form of an ungrouped or grouped pattern. Here some solved problems are given related to the Median in both the cases of ungrouped data and grouped data.
Ungrouped Data Problems
If the data is given as ungrouped data then we need to arrange it in descending and ascending order first and then count the number of given observations as if it is odd or even. Apply the related Median formula on the basis of the total number of observations (n) whether even or odd.
Question 1: Suppose the given data as follows: 61, 46, 49, 64, 57, 38, 21. What is the value of the Median of the given data?
Solution: As the given data is ungrouped so we need to arrange it in ascending order.
Arranged data as follows: 21, 38, 46, 49, 57, 61, 64
Given that the total number of given observations (n) = 7 (odd)
Thus Median formula for an odd number of observations is applied here,
Median = (n+1) / 2 = (7 + 1) / 2 = 4th observation
Hence the value of the Median of the given data = 49
Question 2: Considering the given data as follows: 5, 7, 2, 4, 8, 4. What is the value of the median of the given data?
Solution: As the given data is ungrouped so we need to arrange it in ascending order.
Arranged data as follows: 2, 4, 4, 5, 7, 8
Given that the total number of given observations (n) = 6 (even)
Thus Median formula for an even number of observations is applied here,
Median = [(n / 2)th observation + ((n / 2) + 1)th observation] / 2
Median = (3rd observation + 4th observation) / 2
Median = (4 + 5) / 2 = 9 / 2 = 4.5
Grouped Data Problems
If the data is given as grouped or continuous data in the form of a frequency distribution, then the Median formula to be used is given below. The Median class is the class in which (n / 2) is present.
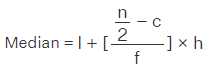
Here, l = Lower limit of Median class
c = Cumulative Frequency of the class preceding the Median class
f = Frequency of the Median class
h = Class size
n = total number of observations i.e. ∑ fᵢ
Question 1: Calculate the Median marks for the given distribution:
| Classes | 0-10 | 10-20 | 20-30 | 30-40 | 40-50 |
| Number of Students | 10 | 2 | 12 | 18 | 3 |
Solution: As we know that given data is continuous and grouped data so we have to find the cumulative frequencies of the given data for calculating the value of the median.
| Classes | Number of students | Cumulative frequency |
| 0-10 | 10 | 10 |
| 10-20 | 2 | 2 + 10 = 12 |
| 20-30 | 12 | 12 + 12 = 24 |
| 30-40 | 18 | 18 + 24 = 42 |
| 40-50 | 3 | 3 + 42 = 45 |
The total number of observations (n) i.e. ∑ fᵢ = 45
n/2 = 45/2 = 22.5
Median Class in which 22.5 is present = 20-30
So, l = 20, f = 12, c = 8, h = 10
By applying the Median formula,
Median = l + [((n / 2) − c) / f] × h
Median = 20 + [(22.5 - 8) / 12] × 10
Median = 32.08 (Approx.)
Question 2: Calculate the Median value for the given distribution:
| Category | 0-10 | 10-20 | 20-30 | 30-40 | 40-50 |
| Frequency | 7 | 22 | 9 | 28 | 13 |
Solution: As we know that given data is continuous and grouped data so we have to find the cumulative frequencies of the given data for calculating the value of the median.
| Category | Frequency | Cumulative Frequency |
| 0-10 | 7 | 7 |
| 10-20 | 22 | 22 + 7 = 29 |
| 20-30 | 9 | 9 + 29 = 38 |
| 30-40 | 28 | 28 + 38 = 66 |
| 40-50 | 13 | 13 + 66 = 79 |
The total number of observations (n) i.e. ∑ fᵢ = 79
n/2 = 79 / 2 = 39.5
Median Class in which n/2 (i.e. 39.5) is present = 30 - 40
So, l = 30, f = 28, c = 38, h = 10
By applying the Median formula,
Median = l + [((n / 2) − c) / f] × h
Median = 30 + [(39.5 - 38) / 28] × 10
Median = 30.53 (Approx.)
Mode Formula
Mode is defined as the value that refers to the most frequently occurring number or observation in a given data set. In simple words, the number/ observations having the highest frequency is known as the mode of given data. The range here denotes the difference between the highest and lowest values of observations in the given data set. It is to be noted here that MODE stands for Most Often Data Entered. It is also remembered that the data set may have no mode, 1 mode, or more than 1 mode. On the basis of the number of modes of given data, the data set can be known as unimodal, bimodal, trimodal, or multimodal.
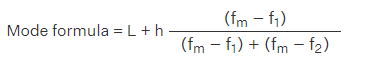
Here,
L denotes the lower limit of the modal class.
h denotes the size of the class interval.
fm denotes the frequency of the modal class.
f1 denotes the frequency of the class preceding the modal class.
f2 denotes the frequency of the class succeeding the modal class.
Mode Formula Solved Questions
The data can be given in the form of an ungrouped or grouped pattern. Here some solved problems are given related to the Mode in both the cases of ungrouped data and grouped data. If the given data is ungrouped data, then we only have to find the observation or number that repeats the maximum number of times.
Mode = Observation having the maximum frequency
Question 1: Considering the age of students = {17,14,15,17,16,18,17}. Calculate the value of the mode of the given data set with the help of the mode formula in statistics.
Solution: Given set of data is {17,14,15,17,16,18,17}
By using the mode formula,
Mode = Observation having the maximum frequency
So we get, that there is only one number occurring many times. Hence it is called unimodal data of age of students.
The value of Mode is the number that repeats itself i.e. 17
Question 2: Calculate the value of the mean, median, mode, and range for the given list of observations: 12, 17, 14, 15, 12, 17, 12, 20, 12
Solution: Given data set: 12, 17, 14, 15, 12, 17, 12, 20, 12
For finding the value of the mean,
Mean = {12 + 17 + 14 + 15 + 12 + 17 + 12 + 20 + 12} / 9 = 131/ 9 = 14.55
For finding the value of the median, first, we need to arrange the list in ascending order as mentioned below:
12, 12, 12, 12, 14, 15, 17, 17, 20
There are 9 (odd) observations in the given list, so the middle most observation of the above data set will be = (9 + 1) / 2 = 10 / 2 = 5 = 5th observation
Thus, the value of the median is 14.
For finding the value of the mode, find the observation that is repeated more often than any other.
Here 12 is the value of the mode that is repeated 4 times in the given data set.
For finding the value of the range, first, find the largest observation and smallest observation in the list. Here the largest value is 20 and the smallest value is 12.
Thus the value of the range is 20 – 12 = 8.
Mean = 14.55
Median = 14
Mode = 12
Range = 8